| Automated charting and reporting |
General Tutorials
Style Examples
SharpLeaf Tutorials
Document Layout Tutorials
Text Flow Tutorials
Table Tutorials
Visual Glossaries
SharpPlot Reference
SharpPlot Class
SharpPlot Properties
SharpPlot Methods
SharpPlot Structures
SharpPlot Enumerations
PageMap Class
SharpLeaf Reference
SharpLeaf Class
SharpLeaf Properties
SharpLeaf Methods
Table Class
Table Properties
Table Methods
SharpLeaf Structures
FontType Structure
ParagraphStyle Structure
BoxStyle Structure
SharpLeaf Enumerations
DocumentLayout Classes
DocumentLayout Class
PageLayout Class
PageElement Abstract Class
Frame : PageElement Class
TextBlock : PageElement Class
ImageBlock : PageElement Class
Box : PageElement Class
Rule : PageElement Class
Common Reference
Document Class
VectorMath Class
DbUtil Class
Download
Release Notes
Licensing
SharpPlot Tutorials > Chart Samples > Network Map for nodes and links
Network Map for nodes and links
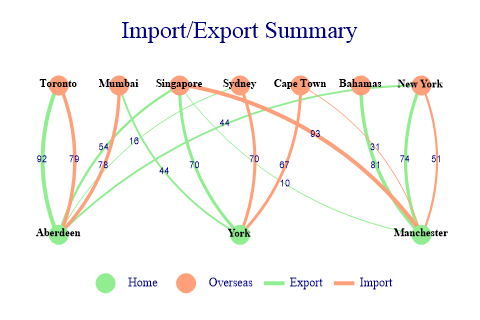
The Network Map offers the ability to display a list of nodes and all their mutual links. The DrawNetworkMap help page demonstrates that flat links are suited for an unoriented dense network on the default (circular) layout. Let’s explore a few more uses of network maps.
Sparse link matrix
As long as the link matrix is sparse, laying out the network map is more a matter of taste than a challenge for readability. In particular, if there are links only across distinct subsets of nodes, then horizontal or vertical layout is perfectly suited.
Here we split links by origin node, which is a convenient alternative to arrows to emphase the orientation of arcs (which are all clockwise since all the data is positive and that NetworkMapStyles.CounterClockwise is not used)
data = new int[][]{new int[]{0,0,0,92,0,54,16,0,0,44},new int[]{0,0,0,0,44,70,0,0,0,
         0},new int[]{0,0,0,0,0,10,0,0,81,74},new int[]{79,0,0,0,0,0,0,0,0,0},new
         int[]{78,0,0,0,0,0,0,0,0,0},new int[]{0,0,93,0,0,0,0,0,0,0},new int[]{0,70,
         0,0,0,0,0,0,0,0},new int[]{0,67,31,0,0,0,0,0,0,0},new int[]{0,0,0,0,0,0,0,
         0,0,0},new int[]{0,0,51,0,0,0,0,0,0,0}};
cat = new int[] {1,1,1,2,2,2,2,2,2,2};

sp.Heading = "Import/Export Summary";
sp.SetMargins(60,60,40,40);

sp.SetColors(new Color[]{Color.LightGreen,Color.LightSalmon});
sp.SetLineStyles(LineStyle.Solid);
sp.SetMarkers(Marker.Bullet);
sp.SetPenWidths(3);
sp.SetMarkerScales(5);
sp.SetNetworkMapLinkArc(-45);  // 45-degree arcs

sp.NetworkMapStyle = (NetworkMapStyles.NoAxes|NetworkMapStyles.Horizontal|
         NetworkMapStyles.SplitByOrigin|NetworkMapStyles.OnTopMarkers|
         NetworkMapStyles.FixedArcs|NetworkMapStyles.ValueTags);
sp.SetILabels(new string[]{"Aberdeen","York","Manchester","Toronto","Mumbai",
         "Singapore","Sydney","Cape Town","Bahamas","New York"});
sp.SetILabelFont("Times",8,FontStyle.Bold,Color.Black);
sp.SetValueFont("Arial",7,FontStyle.Regular,Color.Navy);
sp.SetKeyText(new string[]{"Home","Overseas","Export","Import"});
sp.KeyStyle = (KeyStyles.BottomAlign|KeyStyles.CenterAlign);

sp.SplitBy(cat);
sp.DrawNetworkMap(data);
We even have room to put value tags on links and labels on nodes!
Dense, oriented link matrix
Dense networks are far more challenging, especially when oriented – that is we want to easily distinguish the two links between any two nodes corresponding to the two possible directions.
In this example the goal is to focus on the ability to quickly identify large links and their destination nodes. The circular (default) layout for nodes is generally best when the link matrix is dense. Also, notice how the automatic arc radius make links more visible as it tends towards a half-circle when nodes are close.
We split links by destination node, and use flashy colors on a black background. Because we have many nodes, we use mutually prime sizes for color and marker cycles, so that combinations are unique. The ArrowLines style is not strictly necessary because the arcs are clock-wise, and colored by destination, but it still helps readability. Because links typically share the color of the node they point to, we require the Dissected style too.

data = new int[][]{new int[]{9,3,12,11,38,20,11,8,29,98,19,81},new int[]{144,2,40,
         17,102,506,164,33,299,1,83,302},new int[]{7,375,9,28,23,159,11,79,75,0,76,
         13},new int[]{16,114,18,237,20,99,0,256,168,248,39,22},new int[]{150,370,
         118,370,410,425,5,33,79,27,44,68},new int[]{48,140,259,487,92,198,64,64,11,
         20,26,47},new int[]{210,1,162,21,80,71,108,31,2,141,0,178},new int[]{21,94,
         195,159,33,264,33,101,210,36,367,4},new int[]{33,156,0,207,104,65,7,3,27,1,
         12,1},new int[]{59,87,137,30,531,22,267,140,30,32,125,40},new int[]{27,61,
         226,14,65,145,66,3,189,213,3,690},new int[]{259,589,361,260,185,27,15,138,
         5,12,22,45}};
ids = new int[]{1,9,22,46,48,60,62,70,79,81,90,98};

sp.Heading = "Data transfers by consumer";
sp.SetHeadingFont("Times",18,FontStyle.Regular,Color.LightGray);
sp.SetBackground(Color.Black);
sp.SetMargins(55,25,30,100);

sp.SetMarkers(new Marker[]{Marker.Triangle,Marker.Del});
sp.SetMarkerScales(1.5);
sp.SetPenWidths(3);
sp.SetLineStyles(LineStyle.Solid);
sp.SetColors(new Color[]{Color.Blue,Color.Yellow,Color.Cyan,Color.Magenta,
         Color.Lime,Color.Red,Color.White});

sp.NetworkMapStyle = (NetworkMapStyles.NoAxes|NetworkMapStyles.SplitByDestination|
         NetworkMapStyles.ArrowLines|NetworkMapStyles.Dissected|
         NetworkMapStyles.NoLinkKey);
sp.KeyStyle = (KeyStyles.Vertical|KeyStyles.RightAlign|KeyStyles.BottomAlign);
sp.SetKeyFont("Arial",7,FontStyle.Regular,Color.LightGray);
sp.KeyFormat = "192.168.0.XXX";

sp.DataStyle = DataStyles.Rows;  // Series are given by destination node
sp.SplitBy(ids);  // Links are split by destination node
sp.DrawNetworkMap(data);
We also rely on the fact that SplitBy categories are used as default keys (and disable it for links).
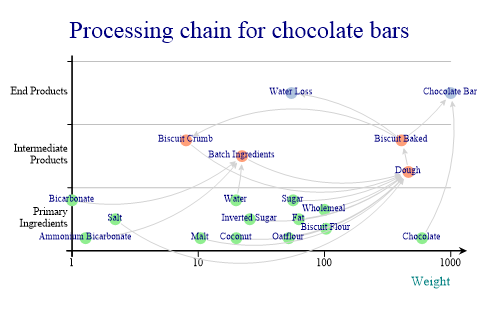
Using X/Y Coordinates
So far we’ve used automatic layout of nodes, but we can specify the X/Y positions of nodes. In this example, the X coordinates encodes the quantity rather than the link width which is fixed. The Y coordinate encodes the category.
links = new double[][] {new double[] {0,0,0,0,0,0,0,0,0,0,0,0,0,0,1,0,0,0,0},new
         double[] {0,0,0,0,0,0,0,0,0,0,0,0,0,0,1,0,0,0,0},new double[] {0,0,0,0,0,0,
         0,0,0,0,0,0,0,0,1,0,0,0,0},new double[] {0,0,0,0,0,0,0,0,0,0,0,0,0,0,0,1,0,
         0,0},new double[] {0,0,0,0,0,0,0,0,0,0,0,0,0,0,0,1,0,0,0},new double[] {0,
         0,0,0,0,0,0,0,0,0,0,0,0,0,0,1,0,0,0},new double[] {0,0,0,0,0,0,0,0,0,0,0,0,
         0,0,0,1,0,0,0},new double[] {0,0,0,0,0,0,0,0,0,0,0,0,0,0,0,1,0,0,0},new
         double[] {0,0,0,0,0,0,0,0,0,0,0,0,0,0,0,1,0,0,0},new double[] {0,0,0,0,0,0,
         0,0,0,0,0,0,0,0,0,1,0,0,0},new double[] {0,0,0,0,0,0,0,0,0,0,0,0,0,0,0,1,0,
         0,0},new double[] {0,0,0,0,0,0,0,0,0,0,0,0,0,0,0,1,0,0,0},new double[] {0,
         0,0,0,0,0,0,0,0,0,0,0,0,0,0,0,0,0,0},new double[] {0,0,0,0,0,0,0,0,0,0,0,0,
         0,0,0,0,0,0,1},new double[] {0,0,0,0,0,0,0,0,0,0,0,0,0,0,0,1,0,0,0},new
         double[] {0,0,0,0,0,0,0,0,0,0,0,0,0,0,0,0,0,1,0},new double[] {0,0,0,0,0,0,
         0,0,0,0,0,0,0,0,0,1,0,0,0},new double[] {0,0,0,0,0,0,0,0,0,0,0,0,1,0,0,0,1,
         0,1},new double[] {0,0,0,0,0,0,0,0,0,0,0,0,0,0,0,0,0,0,0}};
nodes = new string[]{"Ammonium Bicarbonate","Bicarbonate","Water","Biscuit Flour",
         "Wholemeal","Oatflour","Coconut","Sugar","Inverted Sugar","Malt","Fat",
         "Salt","Water Loss","Chocolate","Batch Ingredients","Dough","Biscuit "+
         "Crumb","Biscuit Baked","Chocolate Bar"};
cat = new int[] {1,1,1,1,1,1,1,1,1,1,1,1,3,1,2,2,2,2,3};
catlabs = new string[]{"Primary Ingredients","Intermediate Products","End Products"};
xpos = new double[] {1.28,1,19.92,102.8,99.8,52,20,56.4,25.6,10.4,62.6,2.2,54.7,
         592.7,22.2,462,8,407.3,1000};
ypos = new double[] {120,180,180,135,165,120,120,180,150,120,150,150,350,120,250,
         225,275,275,350};

sp.Heading = "Processing chain for chocolate bars";
sp.MarginLeft = 50;

sp.XAxisStyle = (XAxisStyles.LogScale|XAxisStyles.ArrowedAxis);
sp.XCaption = "Weight";
sp.SetYTickMarks(100);
sp.YAxisStyle = (YAxisStyles.MiddleLabels|YAxisStyles.GridLines);
sp.SetYLabels(catlabs);

sp.SetPenWidths(1);
sp.SetLineStyles(LineStyle.Solid);
sp.SetMarkers(Marker.Bullet);
sp.SetMarkerScales(3);
sp.SetColors(new Color[]{Color.LightGreen,Color.LightSalmon,Color.LightSteelBlue,
         Color.LightGray});
sp.SetArrowStyle(7);  // Fixed-size arrows
sp.SetNetworkMapLinkArc(150);  // Absolute arc radius in points

sp.NetworkMapStyle = (NetworkMapStyles.ArrowLines|NetworkMapStyles.Dissected|
         NetworkMapStyles.FixedArcs|NetworkMapStyles.CounterClockwise);
sp.SetILabelFont("Times",7,FontStyle.Regular,Color.Navy);
sp.SeriesKey = false;  // No key

sp.SetILabels(nodes);
sp.SplitBy(cat,new int[]{1,2,3});  // Force order of categories
sp.DrawNetworkMap(links,xpos,ypos);
A very similar thing would be done if you wanted to overlay a network map over a geographical image, for example.
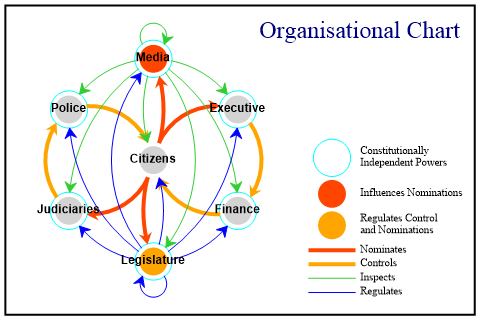
Fine-tuned network maps
Here we’re going to take fine control over the display of individual nodes and links. The special effect on nodes is achieved by a ScatterPlot re-using the X/Y coordinates beforehand.
We use SplitByLink, which applies the SplitBy to links (in provided order), and we use SplitByOrigin on top of it, so that node are split by the category of links to themselves (the diagonal of the link SplitBy).
As with the previous example the data is unitary, but we use different pen widths for different categories. Also, we use negative data to individually inverse the orientation of some links.
data = new int[][]{new int[]{0,-1,1,0,-1,1,0},new int[]{-1,1,1,1,1,0,0},new int[]{0,
         0,0,1,-1,0,0},new int[]{1,0,0,0,-1,0,0},new int[]{-1,1,0,0,1,1,1},new
         int[]{0,-1,0,0,0,0,1},new int[]{1,-1,0,0,0,0,0}};
nodes = new string[]{"Citizens","Media","Executive","Finance","Legislature",
         "Judiciaries","Police"};
x = new int[] {0,0,5,5,0,-5,-5};
y = new int[] {0,6,3,-3,-6,-3,3};
// Link settings are taken in the series order of the input data
// Node categories is diagonal of link categories, that is {2,3,2,2,4,2,2}
linkcat = VectorMath.Enlist(new int[][]{new int[]{2,3,1,1,4,1,1},new int[]{1,3,3,3,
         3,3,3},new int[]{2,2,2,2,4,2,2},new int[]{2,2,2,2,4,2,2},new int[]{1,4,4,4,
         4,4,4},new int[]{2,3,2,2,2,2,2},new int[]{2,3,2,2,2,2,2}});
linkarc = VectorMath.Enlist(new int[][]{new int[]{0,-45,-100,0,-45,-100,0},new
         int[]{-45,-60,-60,-60,-90,-60,-60},new int[]{0,0,0,-100,-60,0,0},new
         int[]{-100,0,0,0,-60,0,0},new int[]{-45,-90,-60,-60,-60,-60,-60},new
         int[]{0,-60,0,0,0,0,-100},new int[]{-100,-60,0,0,0,0,0}});

sp.Heading = "Organisational Chart";
sp.SetHeadingNudge(90,0);  // Nudge further than right margin
sp.SetMargins(40,40,20,150);
sp.FrameStyle = FrameStyles.Boxed;

sp.SetMarkers(Marker.Circle);
sp.SetColors(Color.Aqua);
sp.SetPenWidths(1);
sp.SetMarkerScales(7);
sp.SplitBy(new int[]{0,1,1,1,1,1,1},new int[] {1});  // First marker is excluded
sp.ScatterPlotStyle = ScatterPlotStyles.NoAxes;
sp.SetAxesScales(1);
sp.DrawScatterPlot(y,x);

sp.SetMarkers(Marker.Bullet);
// Color Markers independently of their category
sp.SetMarkerColors(new Color[]{Color.LightGray,Color.OrangeRed,Color.LightGray,
         Color.LightGray,Color.Orange,Color.LightGray,Color.LightGray});
// Link color by category
sp.SetColors(new Color[]{Color.OrangeRed,Color.Orange,Color.LimeGreen,Color.Blue});
// Link width by category (data is only in {-1,0,1})
sp.SetPenWidths(new double[] {3,3,0.5,0.5});
sp.SetLineStyles(LineStyle.Solid);
sp.SetNetworkMapLinkArc(linkarc);
sp.SetArrowStyle(10,30);  // Fixed-size arrows
sp.SetILabelFont("Arial",9,FontStyle.Bold);

sp.NetworkMapStyle = (NetworkMapStyles.NoAxes|NetworkMapStyles.SplitByLink|
         NetworkMapStyles.SplitByOrigin|NetworkMapStyles.ArrowLines|
         NetworkMapStyles.Dissected|NetworkMapStyles.FixedArcs);
sp.SetILabels(nodes);
sp.SplitBy(linkcat,new int[]{1,2,3,4});  // Ensure order for key

sp.DrawNetworkMap(data,x,y);

// First key is for scatter plot
// The second key is empty to exclude nodes of category 2
// (there are no nodes of category 1)
sp.SetKeyText(new string[]{"Constitutionally\nIndependent Powers","","Influences "+
         "Nominations","Regulates Control\nand Nominations","Nominates","Controls",
         "Inspects","Regulates"});
sp.KeyStyle = (KeyStyles.RightAlign|KeyStyles.Vertical|KeyStyles.BottomAlign);
sp.SetKeyFont("Times",8,FontStyle.Regular,Color.Black);
Summary
The Network Map is pretty effective for reasonably sized networks, but can’t do miracles if your data is really big, unless you have a miraculous output resolution.
See also ...
SharpPlot.DrawNetworkMap Method