| Automated charting and reporting |
Chart Samples
Style Examples
SharpLeaf Tutorials
Document Layout Tutorials
Text Flow Tutorials
Table Tutorials
Visual Glossaries
SharpPlot Reference
SharpPlot Class
SharpPlot Properties
SharpPlot Methods
SharpPlot Structures
SharpPlot Enumerations
PageMap Class
SharpLeaf Reference
SharpLeaf Class
SharpLeaf Properties
SharpLeaf Methods
Table Class
Table Properties
Table Methods
SharpLeaf Structures
FontType Structure
ParagraphStyle Structure
BoxStyle Structure
SharpLeaf Enumerations
DocumentLayout Classes
DocumentLayout Class
PageLayout Class
PageElement Abstract Class
Frame : PageElement Class
TextBlock : PageElement Class
ImageBlock : PageElement Class
Box : PageElement Class
Rule : PageElement Class
Common Reference
Document Class
VectorMath Class
DbUtil Class
Download
Release Notes
Licensing
SharpPlot Tutorials > General Tutorials > Adding Links & Handlers
Adding Links & Handlers
SharpPlot makes it particularly easy to add hyperlinks and other JavaScript handlers to your charts. This tutorial shows how you can associate links and some simple handlers with each sector of a piechart. Try clicking on the sectors of the piechart for a simple popup message.

Defining the data
segs = new int[] {67,34,12};
xlabs = new string[]{"Causeway","GraPL","SharpPlot"};
links = new string[]{"http://www.causeway.co.uk","http://www.grapl.net","http://www.sharpplot.com"};
js = new string[]{"alert('Causeway');","alert('GraPL');","alert('SharpPlot');"};
tips = new string[]{"Causeway hits","GraPL hits","SharpPlot hits"};
These are the items used to draw the pie and create the corresponding labels and links.
Step 1: a Plain Piechart
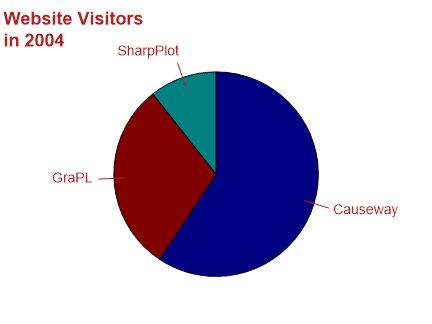
The first step is to set the chart heading, left-aligned this time. Then the pie can be drawn, using a matching font for the labels.
sp.SetMargins(24,0,0,0);
sp.Heading = "Website Visitors\nin 2004";
sp.SetHeadingFont("Arial",18,FontStyle.Bold,Color.Firebrick);
sp.HeadingStyle = HeadingStyles.Left;
sp.SetXLabels(xlabs);
sp.SetLabelFont("Arial",14,Color.Firebrick);
sp.DrawPieChart(segs);
Note that the margins have been adjusted here, as the pie only needs a little space at the top.
Step 2: Linking from the Sectors
Each sector of the chart now has a matching hyperlink from the data.
This example looks just like the previous chart, until you move the mouse over the pie sectors, when you will notice the ‘pointing hand’ cursor appears. In this case the chart has been rendered twice, firstly to create the <area> tags as an imagemap, and then as a 72dpi PNG file.
sp.AddHyperlinks(links);
sp.DrawPieChart(segs);

string map = sp.RenderImageMap(72);
Bitmap chart = sp.RenderBitmap(72));
When the two elements are combined in a webpage, the sectors become hyperlinks.
Step 3: Adding Hints and Scripting
This example shows how you can define an array of tips or actions, which exactly matches the elements in the data. SharpPlot also has overloads for the various ‘Add’ methods to let you target specific data items in this way.
This example has the same image, but with some simple changes to the map. Try clicking on the sectors, and notice that they all have pop-up tips as well as an Alert message.
// Each segment now has a tip and an action
sp.AddTips(tips);
sp.AddAttributes("onClick",js);
sp.DrawPieChart(segs);
map = sp.RenderImageMap(72);
This is probably all you need to enable quite a complex ‘drill-down’ application where the user can explore a large management report simply by clicking on the various graphical elements. However you are limited in what you can do with mapped images – clearly you cannot change the chart content ‘on the fly’ without reloading the entire image.
With VML or SVG, you have much more scope for adding handlers which actively modify the chart in the client browser. The next example simply illuminates the selected pie sector by highlighting the border.
Step 4: Modifying the Graphic Clientside (with VML)
Here is the same chart again, this time without the text.
Assuming you have the VML component of IE 5.5 or above installed, you will see a very similar piechart, but this time the edges change color as you move the mouse over the sectors!
sp.SetEdgeStyle(Color.Maroon,LineStyle.Solid,2);
sp.AddAttributes("onMouseOver","this.strokecolor='Lime'");
sp.AddAttributes("onMouseOut","this.strokecolor='Maroon'");
sp.DrawPieChart(segs);
string vmldemo = sp.RenderVml(false);
The sector edges start maroon this time, and are set to turn bright green when the mouse enters the sector. Obviously, you must set them back again when it leaves! You can change any attribute of the current object in this way (for example you could also increase the line-weight, or change the fill color) or you can change the attributes of a different object entirely. A typical chart might be a complex linegraph where the user can mouse-over the key to highlight a chosen line.
Similar techniques work with SVG charts, but the JavaScript must be modified to take account of the different property names and structure of the SVG document.
See also ...
SharpPlot Members | SharpPlot.AddAttributes Method | SharpPlot.AddHyperlinks Method | SharpPlot.AddTips Method