| Automated charting and reporting |
SharpPlot Tutorials
General Tutorials
Chart Samples
Style Examples
SharpLeaf Tutorials
Document Layout Tutorials
Text Flow Tutorials
Table Tutorials
Visual Glossaries
SharpPlot Class
SharpPlot Properties
SharpPlot Structures
SharpPlot Enumerations
PageMap Class
SharpLeaf Reference
SharpLeaf Class
SharpLeaf Properties
SharpLeaf Methods
Table Class
Table Properties
Table Methods
SharpLeaf Structures
FontType Structure
ParagraphStyle Structure
BoxStyle Structure
SharpLeaf Enumerations
DocumentLayout Classes
DocumentLayout Class
PageLayout Class
PageElement Abstract Class
Frame : PageElement Class
TextBlock : PageElement Class
ImageBlock : PageElement Class
Box : PageElement Class
Rule : PageElement Class
Common Reference
Document Class
VectorMath Class
DbUtil Class
Download
Release Notes
Licensing
SharpPlot Reference > SharpPlot Methods > DrawTowerChart Method
SharpPlot.DrawTowerChart Method
Do 3D grid, and construct towerchart from simple rectangular set of heights.
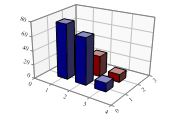
Example
sp = new SharpPlot(180,120);
sp.SetMargins(0,12,18,4);
towers = new int[][]{new int[]{77,65,12},new int[]{34,29,11}};
sp.TowerChartStyle = TowerChartStyles.WallShading|TowerChartStyles.GridLines;
sp.ZAxisStyle = ZAxisStyles.ForceZero;
sp.SetZTickMarks(20);
sp.Perspective = 6;
sp.SetAxisStyle(Color.Gray,LineStyle.Solid,0.5);
sp.DrawTowerChart(towers);
The short tutorial shows a few of the possibilities and some sample code.
Overloads
- public void DrawTowerChart(int[] zData);
- public void DrawTowerChart(double[] zData);
- public void DrawTowerChart(int[][] zData);
- public void DrawTowerChart(double[][] zData);
Description
Towercharts are simply grouped barcharts with the bars drawn ‘behind’ each other rather than in groups along the X-axis. They are best used where the visual effect is more important than the readability of the data values, as it is almost impossible to read the ‘height’ values reliably, and it is very likely that in a crowded chart some towers will be completely obscured.
It may be necessary to allow the user to adjust the tower-spacing and viewpoint to get a clear picture of the relative heights of the towers, and it is generally best to sort the data so that the taller towers are further away from the viewpoint.
See also ...
Tower charts for 3D bars | SharpPlot Members | SharpPlot.TowerChartStyle Property | SharpPlot.SetViewpoint Method