| Automated charting and reporting |
General Tutorials
Chart Samples
SharpLeaf Tutorials
Document Layout Tutorials
Text Flow Tutorials
Table Tutorials
Visual Glossaries
SharpPlot Reference
SharpPlot Class
SharpPlot Properties
SharpPlot Methods
SharpPlot Structures
SharpPlot Enumerations
PageMap Class
SharpLeaf Reference
SharpLeaf Class
SharpLeaf Properties
SharpLeaf Methods
Table Class
Table Properties
Table Methods
SharpLeaf Structures
FontType Structure
ParagraphStyle Structure
BoxStyle Structure
SharpLeaf Enumerations
DocumentLayout Classes
DocumentLayout Class
PageLayout Class
PageElement Abstract Class
Frame : PageElement Class
TextBlock : PageElement Class
ImageBlock : PageElement Class
Box : PageElement Class
Rule : PageElement Class
Common Reference
Document Class
VectorMath Class
DbUtil Class
Download
Release Notes
Licensing
SharpPlot Tutorials > Style Examples > XY Plot
XY Plot
Example
sp.LineGraphStyle = LineGraphStyles.XYPlot;
Linegraphs
The first item of the data array is taken as the X-values. This has the same effect as passing one less column and setting the X-values with the second argument. The default is to assume that all columns of data represent sets of Y-values to be plotted against (1..n) as separate timeseries.
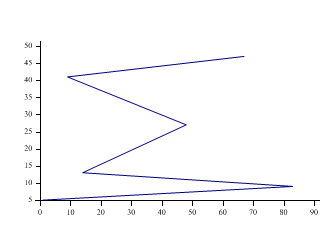
arr_X = new int[] {1,83,14,48,9,67};
arr_Y = new int[] {5,9,13,27,41,47};
data = new int[][]{arr_X,arr_Y};
sp.LineGraphStyle = LineGraphStyles.XYPlot;
sp.DrawLineGraph(data);
Cloud charts (3D scatter)
In this case, the first 2 items are taken as the X and Y values. Columns from 3 onwards are taken as independent data series, giving Z values. This allows you to call Cloud charts passing a single 3-element array of arrays rather that using the xValues and yValues arguments to set the values on the X and Y axes.
See also ...
SharpPlot Members | SharpPlot.CloudChartStyle Property | SharpPlot.LineGraphStyle Property | SharpPlot.MinMaxChartStyle Property | SharpPlot.PolarChartStyle Property