| Automated charting and reporting |
General Tutorials
Chart Samples
SharpLeaf Tutorials
Document Layout Tutorials
Text Flow Tutorials
Table Tutorials
Visual Glossaries
SharpPlot Reference
SharpPlot Class
SharpPlot Properties
SharpPlot Methods
SharpPlot Structures
SharpPlot Enumerations
PageMap Class
SharpLeaf Reference
SharpLeaf Class
SharpLeaf Properties
SharpLeaf Methods
Table Class
Table Properties
Table Methods
SharpLeaf Structures
FontType Structure
ParagraphStyle Structure
BoxStyle Structure
SharpLeaf Enumerations
DocumentLayout Classes
DocumentLayout Class
PageLayout Class
PageElement Abstract Class
Frame : PageElement Class
TextBlock : PageElement Class
ImageBlock : PageElement Class
Box : PageElement Class
Rule : PageElement Class
Common Reference
Document Class
VectorMath Class
DbUtil Class
Download
Release Notes
Licensing
SharpPlot Tutorials > Style Examples > Surface fill is drawn
Surface fill is drawn
Line, Step and Polar charts are shaded down to the X-axis or in to the centre.
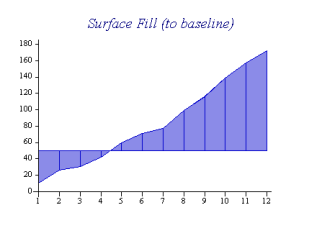
sp.LineGraphStyle = LineGraphStyles.SurfaceShading;
If a chart Baseline is set, this is used as the target for the surface fill rather than the X-axis. Surface fills look good with markers turned off and maybe with Risers (as here).
See also ...
SharpPlot Members | SharpPlot.CloudChartStyle Property | SharpPlot.HistogramStyle Property | SharpPlot.LineGraphStyle Property | SharpPlot.PolarChartStyle Property | SharpPlot.StepChartStyle Property | SharpPlot.TraceChartStyle Property