| Automated charting and reporting |
SharpPlot Tutorials
General Tutorials
Chart Samples
Style Examples
SharpLeaf Tutorials
Document Layout Tutorials
Text Flow Tutorials
Table Tutorials
Visual Glossaries
SharpPlot Class
SharpPlot Properties
SharpPlot Structures
SharpPlot Enumerations
PageMap Class
SharpLeaf Reference
SharpLeaf Class
SharpLeaf Properties
SharpLeaf Methods
Table Class
Table Properties
Table Methods
SharpLeaf Structures
FontType Structure
ParagraphStyle Structure
BoxStyle Structure
SharpLeaf Enumerations
DocumentLayout Classes
DocumentLayout Class
PageLayout Class
PageElement Abstract Class
Frame : PageElement Class
TextBlock : PageElement Class
ImageBlock : PageElement Class
Box : PageElement Class
Rule : PageElement Class
Common Reference
Document Class
VectorMath Class
DbUtil Class
Download
Release Notes
Licensing
SharpPlot Reference > SharpPlot Methods > DrawTreeMap Method
SharpPlot.DrawTreeMap Method
Construct map from integer values, level vector, and altitude.
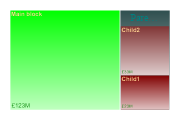
Example
sp.Reset(width,height);
sp.SetMargins(6,6,6,6);

sp.BarEdgeNib = 0;

sp.SetAltitudeColors(new Color[]{Color.Maroon,Color.Gray,Color.Lime});
sp.SetFillStyles(FillStyle.GradientTop);
sp.TreeMapStyle = (TreeMapStyles.ValueTags|TreeMapStyles.AltitudeShading);
sp.ValueTagFormat = "£####M";
sp.SetZRange(0,5);
sp.ZCaption = "Daily difference";

sp.SetXLabelFont("ARB",6,ColorTranslator.FromHtml("#FFD491"));  // Orange

sp.SetXLabels(new string[]{"Main block","Parent block","Child1","Child2"});

area = new int[] {123,56,23,33};
level = new int[] {0,0,1,1};
alt = new int[] {5,3,0,1};

sp.DrawTreeMap(area,level,alt);
Overloads
- public void DrawTreeMap(int[] data);
- public void DrawTreeMap(double[] data);
- public void DrawTreeMap(int[] data,int[] level);
- public void DrawTreeMap(double[] data,int[] level);
- public void DrawTreeMap(double[] data,int level,double[] alt);
- public void DrawTreeMap(int[] data,int[] level,int[] alt);
- public void DrawTreeMap(int[] data,int[] level,double[] alt);
- public void DrawTreeMap(double[] data,int[] level,int[] alt);
- public void DrawTreeMap(double[] data,int[] level,double[] alt);
Description
Draws a standard Heatmap from a tree of area values.
- data
- Area of each rectangle.
- level
- Depth in tree structure (level-0 are roots).
- alt
- Extra dimension for altitude coloring.
See also ...
SharpPlot Members | SharpPlot.TreeMapStyle Property