| Automated charting and reporting |
General Tutorials
Chart Samples
SharpLeaf Tutorials
Document Layout Tutorials
Text Flow Tutorials
Table Tutorials
Visual Glossaries
SharpPlot Reference
SharpPlot Class
SharpPlot Properties
SharpPlot Methods
SharpPlot Structures
SharpPlot Enumerations
PageMap Class
SharpLeaf Reference
SharpLeaf Class
SharpLeaf Properties
SharpLeaf Methods
Table Class
Table Properties
Table Methods
SharpLeaf Structures
FontType Structure
ParagraphStyle Structure
BoxStyle Structure
SharpLeaf Enumerations
DocumentLayout Classes
DocumentLayout Class
PageLayout Class
PageElement Abstract Class
Frame : PageElement Class
TextBlock : PageElement Class
ImageBlock : PageElement Class
Box : PageElement Class
Rule : PageElement Class
Common Reference
Document Class
VectorMath Class
DbUtil Class
Download
Release Notes
Licensing
SharpPlot Tutorials > Style Examples > Altitude shading
Altitude shading
Applies graded colour to tiled response surfaces or contour plots.
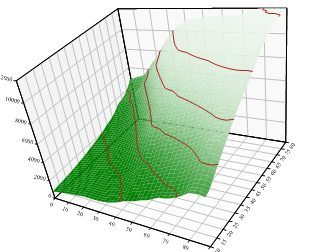
sp.ResponsePlotStyle = ResponsePlotStyles.AltitudeShading;
This is best used with a computed (and therefore smooth) surface and can work well as a way to show experimental results where the outcome is a function of several variables.
Shading used with Contour plots
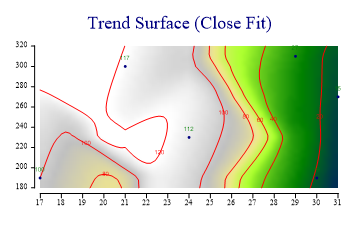
This example shows a fitted surface which is typical of height-map data. Temperature or pressure data would also be a good candidate for this style, using one of the accepted styles of false-color banding.
See also ...
Coarse Altitude shading | Fine Altitude shading | SharpPlot Members | SharpPlot.BubbleChartStyle Property | SharpPlot.CloudChartStyle Property | SharpPlot.ContourPlotStyle Property | SharpPlot.ResponsePlotStyle Property