| Automated charting and reporting |
General Tutorials
Chart Samples
SharpLeaf Tutorials
Document Layout Tutorials
Text Flow Tutorials
Table Tutorials
Visual Glossaries
SharpPlot Reference
SharpPlot Class
SharpPlot Properties
SharpPlot Methods
SharpPlot Structures
SharpPlot Enumerations
PageMap Class
SharpLeaf Reference
SharpLeaf Class
SharpLeaf Properties
SharpLeaf Methods
Table Class
Table Properties
Table Methods
SharpLeaf Structures
FontType Structure
ParagraphStyle Structure
BoxStyle Structure
SharpLeaf Enumerations
DocumentLayout Classes
DocumentLayout Class
PageLayout Class
PageElement Abstract Class
Frame : PageElement Class
TextBlock : PageElement Class
ImageBlock : PageElement Class
Box : PageElement Class
Rule : PageElement Class
Common Reference
Document Class
VectorMath Class
DbUtil Class
Download
Release Notes
Licensing
SharpPlot Tutorials > Style Examples > Inverted Y-scale
Inverted Y-scale
The Y-scale is drawn down from the top.
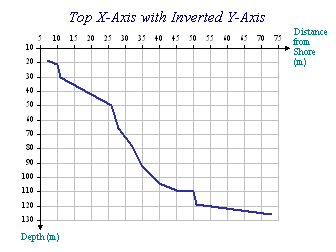
sp.Heading = "Top X-Axis with Inverted Y-Axis";
sp.XAxisStyle = XAxisStyles.ArrowedAxis|XAxisStyles.AtEndCaption|XAxisStyles.TopAxis;
sp.YAxisStyle = YAxisStyles.ArrowedAxis|YAxisStyles.InvertAxis|YAxisStyles.AtEndCaption;
sp.YCaption = "Depth (m)";
sp.XCaption = "Distance from Shore (m)";
This style would always be used with XAxisStyle set to TopAxis – typically to plot depth below ground or sample age. Pollen diagrams are typical.