| Automated charting and reporting |
General Tutorials
Chart Samples
SharpLeaf Tutorials
Document Layout Tutorials
Text Flow Tutorials
Table Tutorials
Visual Glossaries
SharpPlot Reference
SharpPlot Class
SharpPlot Properties
SharpPlot Methods
SharpPlot Structures
SharpPlot Enumerations
PageMap Class
SharpLeaf Reference
SharpLeaf Class
SharpLeaf Properties
SharpLeaf Methods
Table Class
Table Properties
Table Methods
SharpLeaf Structures
FontType Structure
ParagraphStyle Structure
BoxStyle Structure
SharpLeaf Enumerations
DocumentLayout Classes
DocumentLayout Class
PageLayout Class
PageElement Abstract Class
Frame : PageElement Class
TextBlock : PageElement Class
ImageBlock : PageElement Class
Box : PageElement Class
Rule : PageElement Class
Common Reference
Document Class
VectorMath Class
DbUtil Class
Download
Release Notes
Licensing
SharpPlot Tutorials > Style Examples > Contours on mesh surfaces
Contours on mesh surfaces
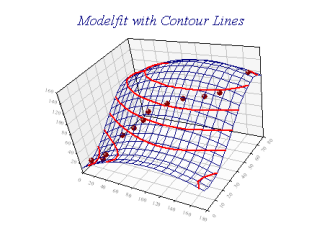
Draws contour lines at each major tickmark on the Z-axis.

sp.ScatterPlotStyle = ScatterPlotStyles.Contours;
Works with the modelfit and trend styles on the Cloud charts. The contour lines will appear smoother if a highr mesh density is used (the default is to compute the fitted surface at each X and Y major tickmark).
In a ScatterPlot and BubbleChart, SetWeightings can be used to weight the height of the data points (in a BubbleChart it is the Z data by default).
See also ...
SharpPlot Members | SharpPlot.BubbleChartStyle Property | SharpPlot.CloudChartStyle Property | SharpPlot.ResponsePlotStyle Property | SharpPlot.ScatterPlotStyle Property