| Automated charting and reporting |
General Tutorials
Chart Samples
SharpLeaf Tutorials
Document Layout Tutorials
Text Flow Tutorials
Table Tutorials
Visual Glossaries
SharpPlot Reference
SharpPlot Class
SharpPlot Properties
SharpPlot Methods
SharpPlot Structures
SharpPlot Enumerations
PageMap Class
SharpLeaf Reference
SharpLeaf Class
SharpLeaf Properties
SharpLeaf Methods
Table Class
Table Properties
Table Methods
SharpLeaf Structures
FontType Structure
ParagraphStyle Structure
BoxStyle Structure
SharpLeaf Enumerations
DocumentLayout Classes
DocumentLayout Class
PageLayout Class
PageElement Abstract Class
Frame : PageElement Class
TextBlock : PageElement Class
ImageBlock : PageElement Class
Box : PageElement Class
Rule : PageElement Class
Common Reference
Document Class
VectorMath Class
DbUtil Class
Download
Release Notes
Licensing
SharpPlot Tutorials > Style Examples > Span data range for Fitting
Span data range for Fitting
The fitted line is not extended beyond the extreme points on the x-axis
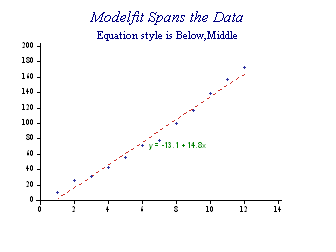
// Set equation under the chart and span the reqression line
 sp.EquationStyle = EquationStyles.Middle|EquationStyles.Below|EquationStyles.SpanData;
 sp.EquationFormat = "y = C0 + C1x";
This may be a useful setting if several regressions are made through subsets of the data.
See also ...
Model fit | Trend lines | SharpPlot.SetModelSpan Method