| Automated charting and reporting |
SharpPlot Tutorials
General Tutorials
Chart Samples
Style Examples
SharpLeaf Tutorials
Document Layout Tutorials
Text Flow Tutorials
Table Tutorials
Visual Glossaries
SharpPlot Class
SharpPlot Properties
SharpPlot Structures
SharpPlot Enumerations
PageMap Class
SharpLeaf Reference
SharpLeaf Class
SharpLeaf Properties
SharpLeaf Methods
Table Class
Table Properties
Table Methods
SharpLeaf Structures
FontType Structure
ParagraphStyle Structure
BoxStyle Structure
SharpLeaf Enumerations
DocumentLayout Classes
DocumentLayout Class
PageLayout Class
PageElement Abstract Class
Frame : PageElement Class
TextBlock : PageElement Class
ImageBlock : PageElement Class
Box : PageElement Class
Rule : PageElement Class
Common Reference
Document Class
VectorMath Class
DbUtil Class
Download
Release Notes
Licensing
SharpPlot Reference > SharpPlot Methods > DrawTriangle Method
SharpPlot.DrawTriangle Method
Create a triangle chart (relative proportions of exactly 3 series):
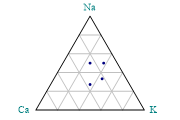
Example
samples = new int[,] {{3,4,4},{4,2,2},{3,4,2},{4,3,1}};

sp.SetMargins(12,6,0,0);
sp.TriangleStyle = TriangleStyles.GridLines|TriangleStyles.Markers;
sp.SetMarkers(Marker.Bullet);

sp.XCaption = "Na";
sp.YCaption = "K";
sp.ZCaption = "Ca";

sp.DrawTriangle(samples);
The short tutorial shows a few of the possibilities and some sample code.
Overloads
- public void DrawTriangle(int[][] data);
- public void DrawTriangle(double[][] data);
- public void DrawTriangle(int[,] data);
- public void DrawTriangle(double[,] data);
- public void DrawTriangle(int[] s1,int[] s2,int[] s3);
- public void DrawTriangle(double[] s1,double[] s2,double[] s3);
Description
This chart is typically used to profile a series of samples of the 3 key constituents of some raw material or industrial process. The data may be shown as proportions or percentages, but it will always be normalised into the range 0-1. If only 2 sets of samples are given, the third set is deduced by subtraction from 1 or 100 as appropriate.
Various styles can be used to vary the appearance of the chart, but the axis range and tick spacing are pre-determined here.
See also ...
Triangle plots for 3-way proportions | SharpPlot Members | SharpPlot.TriangleStyle Property