| Automated charting and reporting |
SharpPlot Tutorials
General Tutorials
Chart Samples
Style Examples
SharpLeaf Tutorials
Document Layout Tutorials
Text Flow Tutorials
Table Tutorials
Visual Glossaries
SharpPlot Class
SharpPlot Properties
SharpPlot Structures
SharpPlot Enumerations
PageMap Class
SharpLeaf Reference
SharpLeaf Class
SharpLeaf Properties
SharpLeaf Methods
Table Class
Table Properties
Table Methods
SharpLeaf Structures
FontType Structure
ParagraphStyle Structure
BoxStyle Structure
SharpLeaf Enumerations
DocumentLayout Classes
DocumentLayout Class
PageLayout Class
PageElement Abstract Class
Frame : PageElement Class
TextBlock : PageElement Class
ImageBlock : PageElement Class
Box : PageElement Class
Rule : PageElement Class
Common Reference
Document Class
VectorMath Class
DbUtil Class
Download
Release Notes
Licensing
SharpPlot Reference > SharpPlot Methods > DrawTraceChart Method
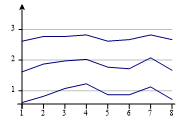
SharpPlot.DrawTraceChart Method
Seismometer-style chart with multiple parallel traces.
Example
sp = new SharpPlot(180,120);
sp.SetMargins(12,12,18,4);
tracedata = new int[][]{new int[]{0,4,9,12,5,5,10,2},new int[]{0,5,7,8,3,2,9,1},new
         int[]{0,3,3,4,0,1,4,1}};
sp.YAxisStyle = YAxisStyles.GridLines|YAxisStyles.ArrowedAxis;
sp.IAxisStyle = IAxisStyles.PlainAxis;
sp.DrawTraceChart(tracedata);
The short tutorial shows a few of the possibilities and some sample code.
Overloads
- public void DrawTraceChart(int[][] data);
- public void DrawTraceChart(double[][] data);
- public void DrawTraceChart(int[][] data,int[] xValues);
- public void DrawTraceChart(double[][] data,int[] xValues);
- public void DrawTraceChart(int[][] data,double[] xValues);
- public void DrawTraceChart(double[][] data,double[] xValues);
Description
Trace charts are a slightly specialist style of plot, originally designed for data from devices like seismographs and EEGs where multiple pens trace out (almost) parallel lines. Each pen is allocated a tickmark on the Y-axis and then an ‘inner axis’ is created for it (naturally these inner axes are all scaled identically). The trace may be filled (a style of chart often used to show inventories in a tank-farm at an oil refinery) or it may be drawn symmetrically to create a style called a ‘Kite diagram’ which often appears in botanical studies of vegetation coverage.
See also ...
Trace charts for multiple series | SharpPlot Members | SharpPlot.TraceChartStyle Property