| Automated charting and reporting |
SharpPlot Tutorials
General Tutorials
Chart Samples
Style Examples
SharpLeaf Tutorials
Document Layout Tutorials
Text Flow Tutorials
Table Tutorials
Visual Glossaries
SharpPlot Class
SharpPlot Properties
SharpPlot Structures
SharpPlot Enumerations
PageMap Class
SharpLeaf Reference
SharpLeaf Class
SharpLeaf Properties
SharpLeaf Methods
Table Class
Table Properties
Table Methods
SharpLeaf Structures
FontType Structure
ParagraphStyle Structure
BoxStyle Structure
SharpLeaf Enumerations
DocumentLayout Classes
DocumentLayout Class
PageLayout Class
PageElement Abstract Class
Frame : PageElement Class
TextBlock : PageElement Class
ImageBlock : PageElement Class
Box : PageElement Class
Rule : PageElement Class
Common Reference
Document Class
VectorMath Class
DbUtil Class
Download
Release Notes
Licensing
SharpPlot Reference > SharpPlot Methods > DrawMinMaxChart Method
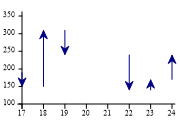
SharpPlot.DrawMinMaxChart Method
Construct hi-lo plot, joining maximum with minimum data values for each axis value.
Example
sp = new SharpPlot(180,120);
sp.SetMargins(12,12,18,4);
open = new int[] {190,150,310,240,140,170};
close = new int[] {150,310,240,140,170,240};
xdata = new int[] {17,18,19,22,23,24};
sp.SetMarkers(Marker.Bullet);
sp.MinMaxChartStyle = MinMaxChartStyles.ArrowLines|MinMaxChartStyles.DriftMarkers;
sp.DrawMinMaxChart(open,close,xdata);
The short tutorial shows a few of the possibilities and some sample code.
Overloads
- public void DrawMinMaxChart(int[] maxValues);
- public void DrawMinMaxChart(double[] maxValues);
- public void DrawMinMaxChart(int[] maxValues,int[] minValues);
- public void DrawMinMaxChart(double[] maxValues,double[] minValues);
- public void DrawMinMaxChart(int[] maxValues,int[] minValues,int[] axisValues);
- public void DrawMinMaxChart(double[] maxValues,double[] minValues,int[] axisValues);
- public void DrawMinMaxChart(double[] maxValues,double[] minValues,double[] axisValues);
Description
Some data series are best represented by their range at each time-value. Temperature data is typical – here the most informative chart shows the maximum and minimum values by day, with the range drawn as a vertical line. This chart is also commonly used for stock-price data where the daily high and low may be combined with opening and closing values to produce a wide variety of typical ‘Wall Street Journal’ plots of the market data.
This chart is normally drawn vertically, but may be switched around using the ‘Horizontal’ style where it is more appropriate to show the range running across the page.
See also ...
Min-Max or Hi-Lo charts | SharpPlot Members | SharpPlot.MinMaxChartStyle Property