| Automated charting and reporting |
General Tutorials
Chart Samples
SharpLeaf Tutorials
Document Layout Tutorials
Text Flow Tutorials
Table Tutorials
Visual Glossaries
SharpPlot Reference
SharpPlot Class
SharpPlot Properties
SharpPlot Methods
SharpPlot Structures
SharpPlot Enumerations
PageMap Class
SharpLeaf Reference
SharpLeaf Class
SharpLeaf Properties
SharpLeaf Methods
Table Class
Table Properties
Table Methods
SharpLeaf Structures
FontType Structure
ParagraphStyle Structure
BoxStyle Structure
SharpLeaf Enumerations
DocumentLayout Classes
DocumentLayout Class
PageLayout Class
PageElement Abstract Class
Frame : PageElement Class
TextBlock : PageElement Class
ImageBlock : PageElement Class
Box : PageElement Class
Rule : PageElement Class
Common Reference
Document Class
VectorMath Class
DbUtil Class
Download
Release Notes
Licensing
SharpPlot Tutorials > Style Examples > Parity plot
Parity plot
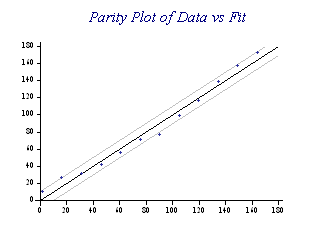
Forces a ScatterPlot to be drawn with identical x and y axes, and adds a leading diagonal axis with optional tolerance guidelines.

sp.SetMarkers(Marker.Bullet);
sp.ScatterPlotStyle = ScatterPlotStyles.Parity;
sp.Heading = "Parity Plot of Data vs Fit";
sp.ParityTolerance = 10;
sp.ParityStyle = ParityStyles.Absolute;
This chart is generally used to compare a theoretical behaviour with actual data, and to look out for values which exceed some preset tolerance. The limits may be drawn at fixed values (as here) or as percentage or ratio values.
SetAxesScales may be used with a value of 1 in conjunction of Parity to force normal axes, but then the axes may not have identical ranges.
See also ...
Balanced Axis | SharpPlot Members | SharpPlot.ParityStyle Property | SharpPlot.ParityTolerance Property | SharpPlot.ScatterPlotStyle Property | SharpPlot.SetParityLimitStyle Method | SharpPlot.SetParityLineStyle Method | SharpPlot.SetParityZoneStyle Method