| Automated charting and reporting |
General Tutorials
Chart Samples
SharpLeaf Tutorials
Document Layout Tutorials
Text Flow Tutorials
Table Tutorials
Visual Glossaries
SharpPlot Reference
SharpPlot Class
SharpPlot Properties
SharpPlot Methods
SharpPlot Structures
SharpPlot Enumerations
PageMap Class
SharpLeaf Reference
SharpLeaf Class
SharpLeaf Properties
SharpLeaf Methods
Table Class
Table Properties
Table Methods
SharpLeaf Structures
FontType Structure
ParagraphStyle Structure
BoxStyle Structure
SharpLeaf Enumerations
DocumentLayout Classes
DocumentLayout Class
PageLayout Class
PageElement Abstract Class
Frame : PageElement Class
TextBlock : PageElement Class
ImageBlock : PageElement Class
Box : PageElement Class
Rule : PageElement Class
Common Reference
Document Class
VectorMath Class
DbUtil Class
Download
Release Notes
Licensing
SharpPlot Tutorials > Style Examples > Error bars are added to MinMax plots
Error bars are added to MinMax plots
Adds ‘T-pieces’ to each end of Min-max charts to make traditional-style error-bars – you can restrict the bars to the ‘far’ end of each bar with the ‘drift’ style.
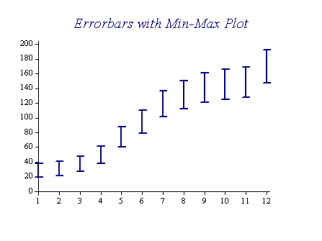
sp.MinMaxChartStyle = MinMaxChartStyles.ErrorBars;
sp.BoxPlotStyle = BoxPlotStyles.ErrorBars;
The bars scale in proportion to the current pen width weight.
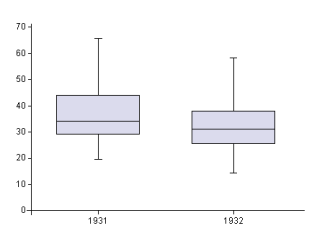
The effect is similar when the style is used with the Box-and-Whisker chart.
See also ...
SharpPlot Members | SharpPlot.BoxPlotStyle Property | SharpPlot.MinMaxChartStyle Property