| Automated charting and reporting |
General Tutorials
Style Examples
SharpLeaf Tutorials
Document Layout Tutorials
Text Flow Tutorials
Table Tutorials
Visual Glossaries
SharpPlot Reference
SharpPlot Class
SharpPlot Properties
SharpPlot Methods
SharpPlot Structures
SharpPlot Enumerations
PageMap Class
SharpLeaf Reference
SharpLeaf Class
SharpLeaf Properties
SharpLeaf Methods
Table Class
Table Properties
Table Methods
SharpLeaf Structures
FontType Structure
ParagraphStyle Structure
BoxStyle Structure
SharpLeaf Enumerations
DocumentLayout Classes
DocumentLayout Class
PageLayout Class
PageElement Abstract Class
Frame : PageElement Class
TextBlock : PageElement Class
ImageBlock : PageElement Class
Box : PageElement Class
Rule : PageElement Class
Common Reference
Document Class
VectorMath Class
DbUtil Class
Download
Release Notes
Licensing
SharpPlot Tutorials > Chart Samples > Vector fields and directed graphs
Vector fields and directed graphs
This style of plot can be used in two very different ways, to show either directed graphs, or to plot vector fields as a scatter diagram. The examples illustrate both of these.
Plotting a Vector Field
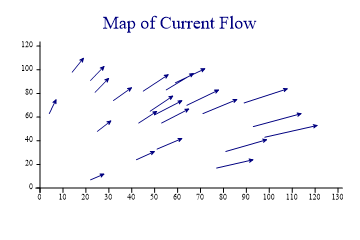
This style of chart is common in oceanography or weather-forecasting. The first (xy) pair is used to plot the location of the reading, and the offset to the second pair represents the direction and value of some measured quantity like windspeed or current flow.
x1 = new int[] {77,25,43,42,93,32,81,14,64,4,71,98,22,51,89,53,24,22,55,45,48,50,59};
y1 = new int[] {17,48,55,24,52,74,31,98,70,63,63,43,7,33,72,55,81,91,83,82,65,62,89};
x2 = new int[] {93,31,51,50,114,40,99,19,78,7,86,121,28,62,108,65,30,28,67,56,58,62,72};
y2 = new int[] {24,57,65,31,63,85,41,110,83,75,75,53,12,42,84,67,93,103,97,96,78,74,101};

sp.Heading = "Map of Current Flow";
sp.VectorStyle = VectorStyles.ArrowLines;
sp.DrawVectors(x1,y1,x2,y2);
Typically the lines have arrowheads to indicate the flow direction. This chart can also be used for any kind of vector field, for example to show the slope at any point on a landscape.
Labelling the Vectors
This example adds value-tags to each vector (giving the length of the line) and shows the ‘root’ of each line as well as the length and direction.
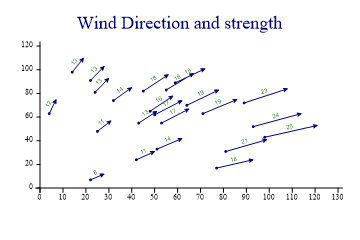
sp.Heading = "Wind Direction and strength";
sp.VectorStyle = VectorStyles.Rooted|VectorStyles.ValueTags|VectorStyles.ArrowLines;
sp.ValueTagFormat = "##0";
sp.SetMarkers(Marker.Bullet);

sp.DrawVectors(x1,y1,x2,y2);
In most cases, you would set your own value data here as the scaling of the lines is generally quite arbitrary.
Simple Connected Graph
This chart can easily be used to draw simple diagrams, typically representing connected tasks, such as an assembly process.
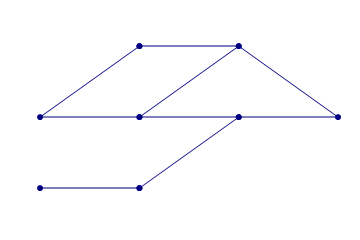
// Links as arrays of (x y x y) values
data = new int[][]{new int[]{1,1,2,1},new int[]{1,2,2,2},new int[]{1,2,2,3},new
         int[]{2,1,3,2},new int[]{2,2,3,2},new int[]{2,2,3,3},new int[]{2,3,3,3},
         new int[]{3,2,4,2},new int[]{3,3,4,2}};

sp.SetPenWidths(1.4);
sp.SetMarkerScales(2);
sp.SetMarkers(Marker.Bullet);
sp.VectorStyle = VectorStyles.Terminated|VectorStyles.Rooted|VectorStyles.NoAxes;

sp.DataStyle = DataStyles.Rows;
sp.DrawVectors(data);
Alternatively, a ScatterPlot could be used to draw the nodes, and the Vector chart simply to add the map of connections.
Drawing a PERT Chart
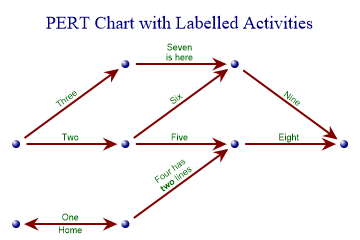
The final example assumes that the arrows represent activities of some kind, and the diagram as a whole illustrates a project plan where activities must be carried out in the correct order.
// Nodes as two arrays
x = new int[] {1,1,2,2,2,3,3,4};
y = new int[] {1,2,1,2,3,2,3,2};

// Links as 4 arrays
x1 = new int[] {1,1,1,2,2,2,2,3,3,2};
y1 = new int[] {1,2,2,1,2,2,3,2,3,1};
x2 = new int[] {2,2,2,3,3,3,3,4,4,1};
y2 = new int[] {1,2,3,2,2,3,3,2,2,1};

sp.SetMargins(60,12,12,12);
sp.Heading = "PERT Chart with Labelled Activities";

sp.SetColors(new Color[]{Color.Navy,Color.Maroon});

// Draw the markers
sp.SetMarkers(Marker.Node);
sp.SetMarkerScales(2);
sp.SetPenWidths(2);

sp.ScatterPlotStyle = ScatterPlotStyles.NoAxes;
sp.DrawScatterPlot(y,x);

// Fill in the labelled lines
sp.VectorStyle = VectorStyles.ArrowLines|VectorStyles.Dissected|VectorStyles.ValueTags;
sp.SetValueTags(new string[]{"One","Two","Three","Four has\n<b>two</b> "+
         "lines","Five","Six","Seven\nis here","Eight","Nine","Home"});
sp.SetArrowStyle(16,24);
sp.SetValueFont("Arial",9,Color.DarkGreen);

sp.DrawVectors(x1,y1,x2,y2);
Here, the activities have been labelled, and the nodes drawn with a separate scatterplot. Notice the use of the ‘Dissected’ style to prevent the arrows from colliding where several lines converge on the same node.
Summary
This chart has several good uses on its own, but is very likely to be combined with standard LineGraphs and ScatterPlots, typically to label bunches of points using indicator lines and notes, or to connect arbitrary points on a timeseries (for example Buy and Sell points in a historical price plot).