| Automated charting and reporting |
Chart Samples
Style Examples
SharpLeaf Tutorials
Document Layout Tutorials
Text Flow Tutorials
Table Tutorials
Visual Glossaries
SharpPlot Reference
SharpPlot Class
SharpPlot Properties
SharpPlot Methods
SharpPlot Structures
SharpPlot Enumerations
PageMap Class
SharpLeaf Reference
SharpLeaf Class
SharpLeaf Properties
SharpLeaf Methods
Table Class
Table Properties
Table Methods
SharpLeaf Structures
FontType Structure
ParagraphStyle Structure
BoxStyle Structure
SharpLeaf Enumerations
DocumentLayout Classes
DocumentLayout Class
PageLayout Class
PageElement Abstract Class
Frame : PageElement Class
TextBlock : PageElement Class
ImageBlock : PageElement Class
Box : PageElement Class
Rule : PageElement Class
Common Reference
Document Class
VectorMath Class
DbUtil Class
Download
Release Notes
Licensing
SharpPlot Tutorials > General Tutorials > Using the Gradient fills
Using the Gradient fills
The way gradients (both linear and radial) are defined varies greatly between output formats, so SharpPlot defines a reasonable set of standard FillStyles for you, and where necessary (surface-filled linegraphs and piecharts) enforces a reasonable bounding rectangle on the fill definition.
All the fills start from the base colour of the data series, and the default is to grade towards the fillstyle ‘30% saturated’, in other words, to stir in approximately three parts white for every one part of the original color. A typical example is:
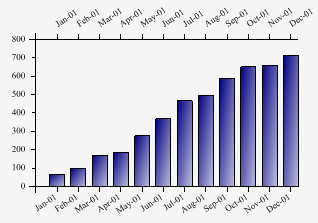
          fs = FillStyle.GradientTopLeft;
          sp.SetFillStyles(fs);
This grades from the default color for the first series (Color.Navy) to the same shade of blue with added white. An easy way to modify this fill is to specify an alternative target color in the FillStyle constructor. For example here is a similar chart but grading towards yellow:
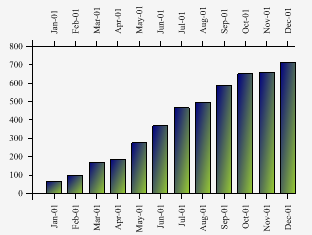
sp.SetFillStyles(new FillStyle(fs,Color.YellowGreen));
If you simply want to have more or less saturation (but maintaining the hue of the series color) you may also override the target FillStyle, for example:
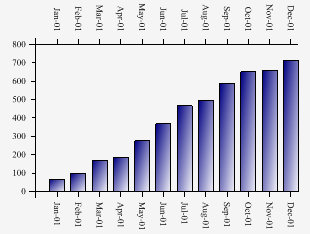
sp.SetFillStyles(new FillStyle(fs,FillStyle.Saturate10));
This gives a stronger gradient effect while preserving the overall color balance.
For barcharts, the bounding rectangle of the fill is simply each bar taken individually. However for filled LineGraphs, SharpPlot always uses the span of the axes to define the fill, to ensure compatible shading between series with different data ranges.
For piecharts, the only fill which makes much sense is FillStyle.Dome which is always defined on the entire pie, rather than sector by sector which looks very strange indeed. Note that this does not work in VML which has no mechanism for overriding the bounding rectangle of a custom fill!