| Automated charting and reporting |
General Tutorials
Style Examples
SharpLeaf Tutorials
Document Layout Tutorials
Text Flow Tutorials
Table Tutorials
Visual Glossaries
SharpPlot Reference
SharpPlot Class
SharpPlot Properties
SharpPlot Methods
SharpPlot Structures
SharpPlot Enumerations
PageMap Class
SharpLeaf Reference
SharpLeaf Class
SharpLeaf Properties
SharpLeaf Methods
Table Class
Table Properties
Table Methods
SharpLeaf Structures
FontType Structure
ParagraphStyle Structure
BoxStyle Structure
SharpLeaf Enumerations
DocumentLayout Classes
DocumentLayout Class
PageLayout Class
PageElement Abstract Class
Frame : PageElement Class
TextBlock : PageElement Class
ImageBlock : PageElement Class
Box : PageElement Class
Rule : PageElement Class
Common Reference
Document Class
VectorMath Class
DbUtil Class
Download
Release Notes
Licensing
SharpPlot Tutorials > Chart Samples > Trace charts for multiple series
Trace charts for multiple series
Trace charts (or ECG plots) are often a convenient way to add an extra dimension to a two-dimensional chart. They are similar in principle to the small multiple, but save a lot of redundant ink when all the series share the same X-axis. Trace-charts are also used as a simple way to draw Kite Diagrams, which are a common graphical tool for botanical field studies.
Several Parallel Timeseries
This chart takes the ‘delta’ of three popular stock prices and shows the daily volatility of each. Note that both BP and the Halifax Bank show the spike around day-50 (the invasion of Iraq) but Kelda (a utility stock) was completely unaffected.

sp.Heading = "Daily Volatility of 3 Stock Prices";

bp = VectorMath.Difference(new int[] {427,428,427,429,424,418,420,424,416,410,406,
         409,403,395,389,380,374,369,356,362,383,383,382,393,386,398,382,379,380,
         394,385,381,388,396,404,393,400,413,417,414,402,400,400,408,408,406,405,
         395,392,395,371,392,400,415,413,414,417,428,416,422,429,416,414,401,416,
         406,407,416,421,411,412,406,405,408,414,407,408,414,412,406,395,403,400,
         397,395,405,411,414,408,416,416,407,413,414,408,414,410,418,415,424,428,
         424,418,428,430,436,430,430,429,432,439,446,439,438,433,438,429,434,431,
         428,424,420,424,420,412,412,410,412,418,414,410,404,407,410,404,405,411,
         415,415,419,419,423,416,423,420,423,426,422,428,421,425,436,442,439,433,
         440,436,442,437,435,432,436,437,429,437,448,448,442,450,442,441,443,439,
         436,440,438,429,422,423,419,423,426,415,415,413,422,420,429,432,432,430,
         435,434,442,435,433,426,426,425,421});
kelda = VectorMath.Difference(new int[] {424,420,418,421,429,440,426,427,419,413,
         415,421,428,428,424,429,411,408,399,403,400,400,402,404,404,412,416,411,
         421,426,423,420,413,419,418,423,428,428,437,434,424,416,410,426,422,422,
         420,410,411,414,408,413,404,409,408,401,408,400,390,381,407,412,410,410,
         408,425,413,415,418,419,420,416,419,425,423,419,422,425,424,416,411,411,
         414,411,408,412,416,415,408,414,419,421,426,430,420,432,425,437,436,437,
         445,436,434,440,440,436,438,435,433,430,427,427,428,429,433,426,428,426,
         423,430,432,426,424,427,430,427,428,427,429,430,426,429,430,430,430,428,
         431,429,430,442,440,442,441,435,435,439,441,440,442,436,438,429,432,432,
         436,438,438,437,443,442,419,419,412,410,404,410,408,406,408,409,412,413,
         414,415,418,418,420,416,420,431,429,435,429,425,423,428,423,424,428,430,
         428,428,423,428,426,426,423,425,427,430});
hbos = VectorMath.Difference(new int[] {655,672,665,659,642,639,638,647,638,647,627,
         629,618,602,589,574,558,578,563,549,538,556,551,589,567,592,581,592,566,
         581,589,600,590,616,619,600,602,596,589,621,638,625,662,668,660,651,651,
         626,608,612,563,598,626,641,652,668,654,690,675,674,684,670,659,650,663,
         672,688,690,720,700,698,691,694,714,737,716,722,739,749,738,726,744,740,
         733,713,737,725,706,707,702,694,699,714,728,715,718,714,708,690,694,721,
         735,723,740,744,750,747,760,762,760,787,790,791,792,806,812,789,805,795,
         806,807,804,793,784,772,785,781,774,793,800,778,766,780,794,796,772,766,
         762,751,765,768,786,786,798,795,792,775,772,769,752,748,748,754,746,733,
         744,750,747,728,717,716,721,718,704,722,730,725,717,722,732,730,717,716,
         720,732,737,738,717,708,718,705,698,692,694,688,716,724,724,716,720,715,
         727,736,750,748,744,735,736,742,740});

sp.YAxisStyle = YAxisStyles.GridLines;
sp.IAxisStyle = IAxisStyles.PlainAxis;

sp.SetYLabels(new string[]{"Kelda","BP","HBOS"});
sp.IAllowance = 1.5;
sp.IIntercept = 0;

trace = new int[][]{kelda,bp,hbos};
sp.DrawTraceChart(trace);
If the series tend to move very closely together, you can set the Inner-axis range to quite a big number (say 1.8) to allow each series to stray into the band occupied by its neighbours. This would be typical of a multiple pen-plotter such as a seismograph.
Inventory Projection for a Tank Farm
An excellent use of the trace-chart is to show the inventory of various liquids as they move through some production process. This gives a very clear picture of what materials are available at each production stage.
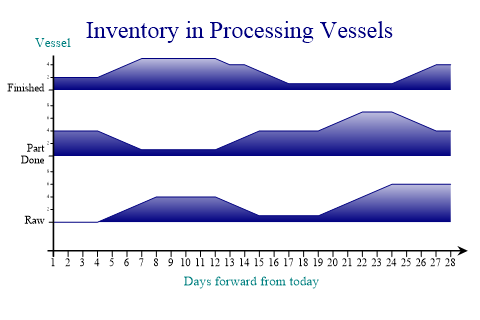
sp.Heading = "Inventory in Processing Vessels";

raw = VectorMath.RunningTotal(new int[] {0,0,0,0,1,1,1,1,0,0,0,0,-1,-1,-1,0,0,0,0,1,
         1,1,1,1,0,0,0,0});
part = VectorMath.RunningTotal(new int[] {4,0,0,0,-1,-1,-1,0,0,0,0,0,1,1,1,0,0,0,0,
         1,1,1,0,0,-1,-1,-1,0});
done = VectorMath.RunningTotal(new int[] {2,0,0,0,1,1,1,0,0,0,0,0,-1,0,-1,-1,-1,0,0,
         0,0,0,0,0,1,1,1,0});

sp.IIntercept = 0;
sp.TraceChartStyle = TraceChartStyles.SurfaceShading;

sp.SetYLabels(new string[]{"Raw","Part\nDone","Finished"});
sp.SetXTickMarks(1);

sp.XAxisStyle = XAxisStyles.ArrowedAxis|XAxisStyles.CenteredCaption;
sp.XCaption = "Days forward from today";

sp.YCaption = "Vessel";
sp.YAxisStyle = YAxisStyles.AtEndCaption;

sp.SetFillStyles(FillStyle.GradientBottom);

trace = new int[][]{raw,part,done};
sp.DrawTraceChart(trace);
This variant of the chart is normally surface-shaded and scaled from ‘empty’ to ‘full’ for each vessel. The example would be a typical display from a production-planning system where the planner was scheduling the processes which moved liquids bwteen the various vessels.
The Kite Diagram
This is a very special-purpose chart, which is simply a reflected version of the surface-filled plot.

sp.Heading = "Sample Kite Chart";

oak = new int[] {0,0,1,2,2,3,3,3,2,1,1,0};
ash = new int[] {0,0,0,0,1,1,1,0,0,0,0,0};
birch = new int[] {0,1,1,1,2,2,2,2,2,2,1,1};
hazel = new int[] {0,1,1,2,2,2,1,0,0,0,0,0};

sp.YCaption = "Species\nobserved";
sp.YAxisStyle = YAxisStyles.AtEndCaption|YAxisStyles.GridLines;
sp.SetYLabels(new string[]{"Oak","Ash","Birch","Hazel"});
sp.XCaption = "Metres\nfrom\nShore";
sp.XAxisStyle = XAxisStyles.AtEndCaption|XAxisStyles.ArrowedAxis;
sp.MarginRight = 48;
sp.TraceChartStyle = TraceChartStyles.KiteDiagram;

sp.SetFillStyles(new FillStyle("25+#CCCC00"));  // NB - #.FillStyle.GradientRight + Orange
sp.SetColors(Color.ForestGreen);

trace = new int[][]{oak,ash,birch,hazel};
sp.DrawTraceChart(trace);
It is commonly used to show vegetation coverage or the results of a pollen analysis. The example shows a count of some common tree-species as we walk inland from a lake-shore into the forest.
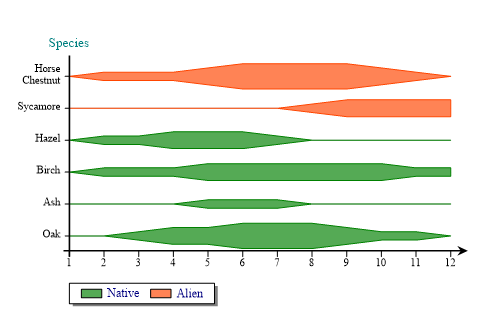
Adding Categories
All styles of Tracechart can categorise data by cycling through colors of fill-styles.
oak = new int[] {0,0,1,2,2,3,3,3,2,1,1,0};
ash = new int[] {0,0,0,0,1,1,1,0,0,0,0,0};
birch = new int[] {0,1,1,1,2,2,2,2,2,2,1,1};
hazel = new int[] {0,1,1,2,2,2,1,0,0,0,0,0};
sycamore = new int[] {0,0,0,0,0,0,0,1,2,2,2,2};
chestnut = new int[] {0,1,1,1,2,3,3,3,3,2,1,0};

sp.YCaption = "Species";
sp.YAxisStyle = YAxisStyles.AtEndCaption|YAxisStyles.GridLines;
sp.SetYLabels(new string[]{"Oak","Ash","Birch","Hazel","Sycamore","Horse Chestnut"});

sp.XAxisStyle = XAxisStyles.ArrowedAxis;
sp.YLabelFormat = "XXXXXXXX;";
sp.MarginLeft = 48;

sp.TraceChartStyle = TraceChartStyles.KiteDiagram;
sp.IAxisStyle = IAxisStyles.PlainAxis;
sp.SetFillStyles(FillStyle.Saturate80);

sp.KeyStyle = KeyStyles.Boxed|KeyStyles.Shadowed;
native = new string[]{"Native","Native","Native","Native","Alien","Alien"};
sp.SplitBy(native);

sp.SetColors(new Color[]{Color.Green,Color.OrangeRed});
sp.SetLineStyles(LineStyle.Solid);

trace = new int[][]{oak,ash,birch,hazel,sycamore,chestnut};
sp.DrawTraceChart(trace);
The example chooses to segregate two types of tree species.
Summary
Trace charts are a surprisingly versatile way of showing a high density of information on a single chart. They are worth considering as alternatives to the standard Linegraph whenever there are many series to be compared.