| Automated charting and reporting |
SharpPlot Tutorials
General Tutorials
Chart Samples
Style Examples
SharpLeaf Tutorials
Document Layout Tutorials
Text Flow Tutorials
Table Tutorials
Visual Glossaries
SharpPlot Class
SharpPlot Properties
SharpPlot Structures
SharpPlot Enumerations
PageMap Class
SharpLeaf Reference
SharpLeaf Class
SharpLeaf Properties
SharpLeaf Methods
Table Class
Table Properties
Table Methods
SharpLeaf Structures
FontType Structure
ParagraphStyle Structure
BoxStyle Structure
SharpLeaf Enumerations
DocumentLayout Classes
DocumentLayout Class
PageLayout Class
PageElement Abstract Class
Frame : PageElement Class
TextBlock : PageElement Class
ImageBlock : PageElement Class
Box : PageElement Class
Rule : PageElement Class
Common Reference
Document Class
VectorMath Class
DbUtil Class
Download
Release Notes
Licensing
SharpPlot Reference > SharpPlot Methods > DrawStepChart Method
SharpPlot.DrawStepChart Method
Construct step chart from data and step start-points.
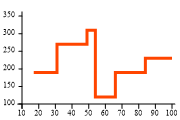
Example
sp = new SharpPlot(180,120);
sp.SetMargins(12,12,18,4);
sp.SetPenWidths(3);
sp.SetColors(Color.OrangeRed);
ydata = new int[] {190,270,310,120,190,230};
xdata = new int[] {17,31,49,54,66,84,100};
sp.DrawStepChart(ydata,xdata);
The short tutorial shows a few of the possibilities and some sample code.
Overloads
- public void DrawStepChart(int[] data);
- public void DrawStepChart(double[] data);
- public void DrawStepChart(int[] data,int[] stepStartValues);
- public void DrawStepChart(double[] data,int[] stepStartValues);
- public void DrawStepChart(int[] data,double[] stepStartValues);
- public void DrawStepChart(double[] data,double[] stepStartValues);
Description
Stepcharts are used for two main purposes – timeseries where the values change discontinuously (interest rates are typical) and summary data where the groups are of variable width (monthly totals). SharpPlot can draw the steps with risers from the X-axis (which has the effect of abutted bars) and with shading down to either the axis or a given reference line.
Note that you often give on more X-value that Y-value here as the X-values give the start-point for each step and there is usually an extra point at the right-hand end to determine how far to draw the final horizontal segment.
See also ...
Step charts for discontinuous data | SharpPlot Members | SharpPlot.StepChartStyle Property