| Automated charting and reporting |
General Tutorials
Style Examples
SharpLeaf Tutorials
Document Layout Tutorials
Text Flow Tutorials
Table Tutorials
Visual Glossaries
SharpPlot Reference
SharpPlot Class
SharpPlot Properties
SharpPlot Methods
SharpPlot Structures
SharpPlot Enumerations
PageMap Class
SharpLeaf Reference
SharpLeaf Class
SharpLeaf Properties
SharpLeaf Methods
Table Class
Table Properties
Table Methods
SharpLeaf Structures
FontType Structure
ParagraphStyle Structure
BoxStyle Structure
SharpLeaf Enumerations
DocumentLayout Classes
DocumentLayout Class
PageLayout Class
PageElement Abstract Class
Frame : PageElement Class
TextBlock : PageElement Class
ImageBlock : PageElement Class
Box : PageElement Class
Rule : PageElement Class
Common Reference
Document Class
VectorMath Class
DbUtil Class
Download
Release Notes
Licensing
SharpPlot Tutorials > Chart Samples > Gantt charts for timewise bars
Gantt charts for timewise bars
The Gantt chart was originally developed as a good way to represent activities across time, and was popularised by tools such as Microsoft Project. It may be used in a variety of planning scenarios, or simply to show the status of some activity or piece of machinery across time (say machine performance across the day).
A Simple Activity Schedule
This example shows four activities planned by week-number.

sp.Heading = "Work Schedule";
todo = new string[]{"","Clear ground","Dig drains","Lay foundations","Concrete floors"};
sp.SetYLabels(todo);

startwk = new int[] {24,28,34,50};
endwk = new int[] {30,36,48,54};
ydata = new int[] {1,2,3,4};

sp.MarginLeft = 72;
sp.YAxisStyle = YAxisStyles.ForceZero|YAxisStyles.GridLines;
sp.SetXTickMarks(5);

sp.DrawGanttChart(ydata,startwk,endwk);
The activity names have been used as axis labels here, but note that you must provide one label per tick-mark, so there is an extra dummy label to go opposite the X-axis. The left-margin will usually need to be made a little wider, even if the labels are wrapped into a preset width (as here).
Categorised and Labelled Activities
This example is very similar, but labels the activities rather than the axis.

sp.Heading = "Work in Progress";
sp.HeadingStyle = HeadingStyles.Right;
todo = new string[]{"Clear ground","Dig drains","Lay foundations","Concrete floors"};
startwk = new int[] {24,28,34,50};
endwk = new int[] {30,36,48,54};
ydata = new int[] {4,3,2,1};
status = new string[]{"Done","Done","Progressing","Not started"};
sp.SetValueFont("Arial",8,FontStyle.Bold);
sp.SetValueTags(todo);
sp.GanttChartStyle = GanttChartStyles.ValueTags;
sp.YAxisStyle = YAxisStyles.ForceZero|YAxisStyles.GridLines|YAxisStyles.NoLabels;
sp.SetXTickMarks(5);
sp.SplitBy(status);
sp.DrawGanttChart(ydata,startwk,endwk);
The activities have been classified depending on status, and are drawn with the earliest at the top of the chart this time.
Using the barwidths to show resources
The third variation on this basic chart uses the widths of each bar to indicate the number of people on site for each phase.
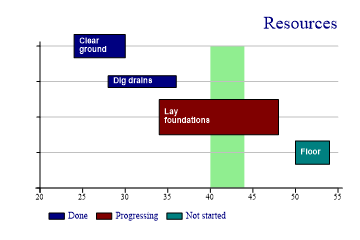
sp.Heading = "Resources";
sp.HeadingStyle = HeadingStyles.Right;
todo = new string[]{"Clear ground","Dig drains","Lay foundations","Floor"};
startwk = new int[] {24,28,34,50};
endwk = new int[] {30,36,48,54};
ydata = new int[] {4,3,2,1};
status = new string[]{"Done","Done","Progressing","Not started"};
resources = VectorMath.Multiply(0.33,new int[] {2,1,3,2});
sp.SetValueFont("Arial",8,FontStyle.Bold,Color.White);
sp.SetValueTags(todo);
sp.ValueTagStyle = ValueTagStyles.Inside;
sp.ValueTagFormat = "XXXXXXXXX;";
sp.GanttChartStyle = GanttChartStyles.ValueTags;
sp.YAxisStyle = YAxisStyles.ForceZero|YAxisStyles.GridLines|YAxisStyles.NoLabels;
sp.SetXTickMarks(5);
sp.SetXZones(new Zone(40,44,Color.LightGreen));
sp.SplitBy(status);
sp.SetBarWidths(resources);
sp.DrawGanttChart(ydata,startwk,endwk);
This time the bars have been labelled inside – be sure there is enough space for the labels if you choose to do this with real data. The widths are given in terms of the Y-scale, so typically the largest bar should be scaled to around 1 unit here.
Note the use of an XZone to indicate a particular period of time – probably a holiday week. You can set an array of zone definitions here to mark out several time intervals if required.
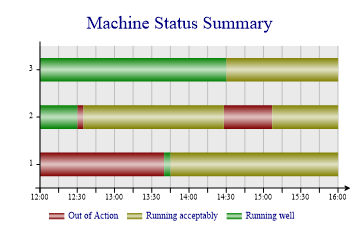
Plant Status Chart
This final chart uses the Gantt style to show historical performance rather than a schedule. The times are given as decimal parts of the day – see DateTime.ToOADate in the .Net framework for the conversion from DateTime objects.
ydata = new int[] {1,2,2,1,2,2,3,1,2,3};
starttime = new double[] {0.5,0.52083,0.60278,0.57291,0.5243,0.62986,0.6041,0.5694,0.5,0.5};
endtime = new double[] {0.5694,0.5243,0.62986,0.6667,0.6028,0.6667,0.6667,0.57291,
         0.52083,0.6041};
// Colours are allocated by state
state = new int[] {2,2,2,3,3,3,3,1,1,1};
sp.Heading = "Machine Status Summary";
sp.SetChartBackground(Color.Silver,FillStyle.Halftone);
sp.SetColors(new Color[]{Color.Maroon,Color.Olive,Color.Green});
sp.SetFillStyles(FillStyle.Pipe);
sp.XAxisStyle = XAxisStyles.Time|XAxisStyles.GridLines|XAxisStyles.ArrowedAxis;
sp.YAxisStyle = YAxisStyles.ExactFit;
sp.SetYRange(0.5,3.5);  // Space around bars
sp.SetYTickMarks(1);
sp.SetXRange(12/24.0,16/24.0); // Lunchtime to 16:00;
sp.BarEdgeNib = 0;
sp.YLabelFormat = "##";  // Eliminate zero
sp.XTimeFormat = "HH:mm";  // Force 23:59 time format (rather than default .Net culture)
sp.SetKeyText(new string[]{"Out of Action","Running acceptably","Running well"});
sp.SplitBy(state);

sp.SetBarWidths(0.5);
sp.DrawGanttChart(ydata,starttime,endtime);
Assuming the state information is complete, each bar will be continous across time, and will show colored bands corresponding to the state of each machine during that period. The gradient fill looks quite good here, but obviously adds no extra information and makes the saved chart a little larger in any of the raster formats.
Summary
This is a fairly special-purpose chart, but is a very convenient way to outline blocks of activities or status across time.