| Automated charting and reporting |
General Tutorials
Style Examples
SharpLeaf Tutorials
Document Layout Tutorials
Text Flow Tutorials
Table Tutorials
Visual Glossaries
SharpPlot Reference
SharpPlot Class
SharpPlot Properties
SharpPlot Methods
SharpPlot Structures
SharpPlot Enumerations
PageMap Class
SharpLeaf Reference
SharpLeaf Class
SharpLeaf Properties
SharpLeaf Methods
Table Class
Table Properties
Table Methods
SharpLeaf Structures
FontType Structure
ParagraphStyle Structure
BoxStyle Structure
SharpLeaf Enumerations
DocumentLayout Classes
DocumentLayout Class
PageLayout Class
PageElement Abstract Class
Frame : PageElement Class
TextBlock : PageElement Class
ImageBlock : PageElement Class
Box : PageElement Class
Rule : PageElement Class
Common Reference
Document Class
VectorMath Class
DbUtil Class
Download
Release Notes
Licensing
SharpPlot Tutorials > Chart Samples > Dials and Gauges for isolated numbers
Dials and Gauges for isolated numbers
The Dial chart is the only charttype in SharpPlot which typically takes a single number, rather than an array. It is possible to use charts like the XBarchart to imitate thermometers and other simple gauges, but the Dial has the benefit of showing some of the context of the data with warning zones, datum lines and other cues.
A Simple Dial to Show One Value
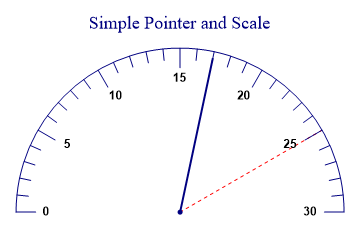
sp.SetMargins(24,24,12,12);
sp.Heading = "Simple Pointer and Scale";
sp.SetAxisStyle(Color.Navy,LineStyle.Solid,1.2);
sp.SetXLabelFont("Arial",12,FontStyle.Bold);

sp.SetPenWidths(2);
sp.SetXRange(0,30);
sp.SetXTickMarks(5,4);
sp.SetDatumLineStyle(Color.Red,LineStyle.Dash,0.8);
sp.SetXDatumLines(25);

sp.DrawDialChart(17);
This chart has a simple pointer, and adds a datum line to show a reasonable maximum value. Note that the x-range is used to range the dial here, and is always required as SharpPlot has no way to guess the correct range from a single data point.
Arrowed Pointer and a Warning Zone
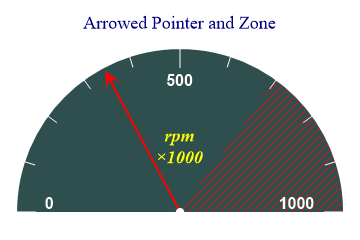
sp.SetMargins(24,24,12,12);
sp.Heading = "Arrowed Pointer and Zone";
sp.SetAxisStyle(Color.White,LineStyle.Solid,2);
sp.SetXLabelFont("Arial",16,FontStyle.Bold,Color.White);
sp.SetChartBackground(Color.DarkSlateGray,FillStyle.Solid);

sp.SetPenWidths(2);
sp.SetColors(Color.Red);

sp.DialChartStyle = DialChartStyles.ArrowLines|DialChartStyles.WedgeZones;
sp.SetXRange(0,1000);
sp.SetXTickMarks(500,4);

xzone = new Zone(700,1000,Color.Red,FillStyle.ForwardDiagonal);
sp.SetXZones(xzone);

sp.XCaption = "rpm\n×1000";
sp.SetXCaptionFont("Times",18,FontStyle.Italic|FontStyle.Bold,Color.Yellow);
sp.CaptionLineSpacing = 120;

sp.DrawDialChart(345);
This chart is designed to look as if it came from an instrument panel. The ‘red zone’ is very prominently marked with a wedge of color and the x-caption is used to label the value. A typical application might use several of these dials to make a ‘cockpit’ view of selected key parameters for a company healthcheck.
Two Warning Zones
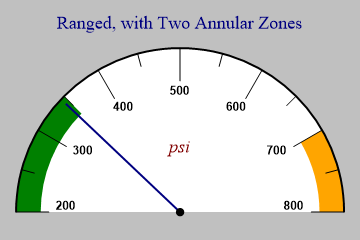
sp.SetMargins(24,24,12,12);

sp.Heading = "Ranged, with Two Annular Zones";
sp.SetAxisStyle(Color.Black,LineStyle.Solid,2);
sp.SetXLabelFont("Arial",12,FontStyle.Bold);

sp.SetPenWidths(2);
sp.SetBackground(Color.Silver,FillStyle.Solid);
sp.SetChartBackground(Color.White,FillStyle.Solid);
sp.SetXRange(200,800);
sp.SetXTickMarks(100,1);

xzones = new Zone[]{new Zone(200,350,Color.Green),new Zone(700,800,Color.Orange)};
sp.SetXZones(xzones);

sp.XCaption = "psi";
sp.SetXCaptionFont("times",18,FontStyle.Italic,Color.Maroon);

sp.DrawDialChart(345);
This chart uses ‘annular’ zones (the default) to show two significant ranges in different colors. This gives a very clear indication of the health (or otherwise) of some key indicator of company performance.
Multiple Pointers and Zones
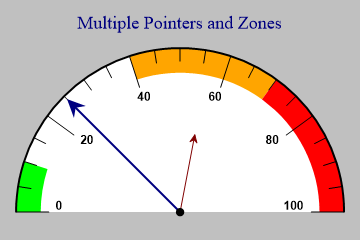
sp.SetMargins(24,24,12,12);

sp.Heading = "Multiple Pointers and Zones";
sp.SetBackground(Color.Silver);
sp.SetChartBackground(Color.White,FillStyle.Solid);
sp.SetAxisStyle(Color.Black,LineStyle.Solid,2);
sp.SetXLabelFont("Arial",12,FontStyle.Bold);

sp.SetColors(new Color[]{Color.Navy,Color.Maroon});
sp.DialChartStyle = DialChartStyles.ArrowLines;
sp.SetPenWidths(new double[] {2,1.2});
sp.SetLineStyles(LineStyle.Solid);
sp.SetArrowStyle(-10);  // Negative arrow size is proportional to line width

sp.SetXRange(0,100);
sp.SetXTickMarks(20,3);

xzones = new Zone[]{new Zone(0,10,Color.Lime),new Zone(40,70,Color.Orange),new
         Zone(70,100,Color.Red)};
sp.SetXZones(xzones);

radii = new int[] {100,50};
data = new int[] {25,56};

sp.DrawDialChart(data,radii);
The final chart has two values, which would typically by shown (as here) with pointers of different lengths. There is no limit to the number of pointers or Zones, but in practice this chart is probably at the limit of what the dial can reasonably display. It would be much better to make a matrix of dials using a trellis to show several related values.