| Automated charting and reporting |
General Tutorials
Style Examples
SharpLeaf Tutorials
Document Layout Tutorials
Text Flow Tutorials
Table Tutorials
Visual Glossaries
SharpPlot Reference
SharpPlot Class
SharpPlot Properties
SharpPlot Methods
SharpPlot Structures
SharpPlot Enumerations
PageMap Class
SharpLeaf Reference
SharpLeaf Class
SharpLeaf Properties
SharpLeaf Methods
Table Class
Table Properties
Table Methods
SharpLeaf Structures
FontType Structure
ParagraphStyle Structure
BoxStyle Structure
SharpLeaf Enumerations
DocumentLayout Classes
DocumentLayout Class
PageLayout Class
PageElement Abstract Class
Frame : PageElement Class
TextBlock : PageElement Class
ImageBlock : PageElement Class
Box : PageElement Class
Rule : PageElement Class
Common Reference
Document Class
VectorMath Class
DbUtil Class
Download
Release Notes
Licensing
SharpPlot Tutorials > Chart Samples > Cloud charts for discrete XYZ data with perspective
Cloud charts for discrete XYZ data with perspective
The CloudChart or XYZ Scatter is a surprisingly versatile method for diagramming data in 3 dimensions. The four examples shown here illustrate a few of the possibilities.
A Simple Scatter plot in XYZ space
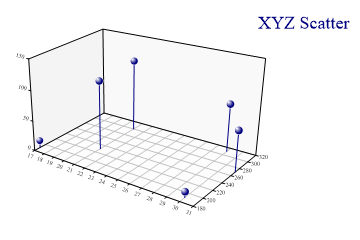
sp.SetMargins(24,32,18,6);
sp.Heading = "XYZ Scatter";
sp.HeadingStyle = HeadingStyles.Right;

zdata = new int[] {12,65,77,117,9,112};
xdata = new int[] {17,31,29,21,30,21};
ydata = new int[] {190,270,310,300,190,230};

sp.CloudChartStyle = CloudChartStyles.WallShading|CloudChartStyles.Risers|
         CloudChartStyles.HaloMarkers;
sp.ZAxisStyle = ZAxisStyles.ForceZero;
sp.XAxisStyle = XAxisStyles.GridLines;
sp.YAxisStyle = YAxisStyles.GridLines|YAxisStyles.FlatText;
sp.SetZTickMarks(50);
sp.SetYTickMarks(20);
sp.SetMarkerScales(2);
sp.SetMarkers(Marker.Ball);

sp.DrawCloudChart(xdata,ydata,zdata);
This style of chart would often be used with a large dataset (several thousand points) to get a feel for the general shape of a distribution. In this example ‘risers’ have been drawn from the xy plane to give a better idea of where the points are placed.
Shaded planes to compare several series
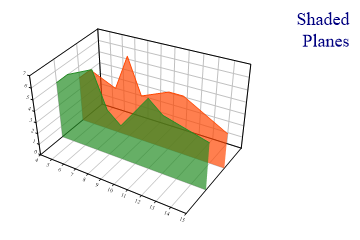
sp.SetMargins(24,24,18,6);

series1 = new int[] {5,6,7,4,3,6,5,4};
series2 = new int[] {4,5,4,7,4,5,5,3};
xdata = new int[] {4,5,7,8,9,11,12,15};

sp.Heading = "Shaded\nPlanes";
sp.HeadingStyle = HeadingStyles.Right;

sp.SetViewpoint(33,18,54);
sp.SetColors(new Color[]{Color.OrangeRed,Color.ForestGreen});
sp.SetFillStyles(FillStyle.Opacity66);
sp.SetLineStyles(LineStyle.Solid);
sp.CloudChartStyle = CloudChartStyles.NoMarkers|CloudChartStyles.SurfaceShading|
         CloudChartStyles.Lines|CloudChartStyles.GridLines;
sp.SetYRange(0.5,2.5);
sp.YAxisStyle = YAxisStyles.PlainAxis;
sp.ZAxisStyle = ZAxisStyles.ForceZero;

sp.DrawCloudChart(xdata,new int[]{2,2,2,2,2,2,2,2},series2);  // First plane
sp.DrawCloudChart(xdata,new int[]{1,1,1,1,1,1,1,1},series1);
This diagram shows the cloud-chart being used in a similar way to the Excel Ribbon chart to compare series. This is generally done for visual effect rather than as a serious attempt to compare the data values. However it does illustrate the versatility of the Cloudchart when used as a general-purpose 3D drawing tool. If you start by setting fixed ranges on all 3 axes, you can draw any number of lines of filled shapes in the rctangular co-ordinate system within the chart walls.
This chart is also drawn with a slightly modified viewpoint. The best viewing angle for any particular dataset is obviously a matter of experiment.
Fitted quadratic surface
Just as the ScatterPlot can fit a regression-line to the data, the Cloudchart can fit a regression surface.
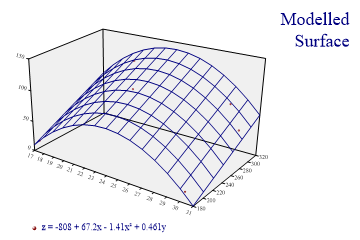
sp.SetMargins(24,32,18,6);

sp.Heading = "Modelled\nSurface";
sp.HeadingStyle = HeadingStyles.Right;

zdata = new int[] {12,65,77,117,9,112};
xdata = new int[] {17,31,29,21,30,24};
ydata = new int[] {190,270,310,300,190,230};

sp.SetZTickMarks(50);

sp.CloudChartStyle = CloudChartStyles.WallShading|CloudChartStyles.ModelFit;
sp.SetWallFillStyles(FillStyle.Halftone);

sp.SetOrderOfFit(2,1);
sp.EquationFormat = "z = C0 + C1x + C2x² + C3y";

sp.ZAxisStyle = ZAxisStyles.ForceZero;
sp.YAxisStyle = YAxisStyles.FlatText;
sp.SetPenWidths(1.2);

sp.SetMarkers(Marker.Node);
sp.DrawCloudChart(xdata,ydata,zdata);
sp.SetKeyText(sp.Equation);
The model in this case is quadratic in the X-direction and linear in Y to give the simple folded surface shown. The order of fit may be up to 4 (quartic) in either direction.
Trend surface with contour lines
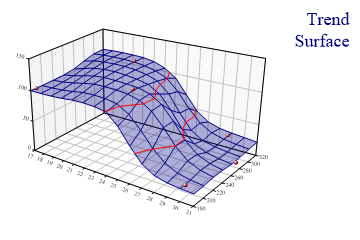
sp.SetMargins(24,32,18,6);

zdata = new int[] {100,15,27,117,19,112};
xdata = new int[] {17,31,29,21,30,24};
ydata = new int[] {190,270,310,300,190,230};

sp.Heading = "Trend\nSurface";
sp.HeadingStyle = HeadingStyles.Right;

sp.SetZTickMarks(50);  // Contour interval also

sp.CloudChartStyle = CloudChartStyles.WallShading|CloudChartStyles.TrendSurface|
         CloudChartStyles.Contours|CloudChartStyles.GridLines|
         CloudChartStyles.TiledSurface;

sp.Flexibility = 1;
sp.ZAxisStyle = ZAxisStyles.ForceZero;
sp.YAxisStyle = YAxisStyles.FlatText;
sp.SetFillStyles(FillStyle.Opacity30);
sp.SetMarkerScales(2);

sp.SetMarkers(Marker.Node);
sp.DrawCloudChart(xdata,ydata,zdata);
This is again the analagous style to the ‘trendline’ available in the ScatterPlot. The surface is a gaussian-weighted smooth which can be controlled with the Flexibility property. With so few points, the sample sets the flex very low indeed as otherwise the surface would resemble a series of plateaux around each point. With a realistically large data array (probably several hundred points) the default flexibility would be more suitable.
Contour lines are drawn at each Z-axis tickmark, and the ‘grid’ is computed at the intersection of each x-y tick. The MeshDensity property can be used to add more points into the mesh to make a smoother surface.
Summary
Cloudcharts can be a really effective way to visualize genuine 3D datasets. However for serious data analysis it is probably better to use a set of simple 2D charts to show appropriate sections through the data.